Using the monthly housing starts data for May 2026 released by the Toyama Prefecture Construction and Housing Division, we can see the changes in the market and money trends from April to May.
Here are the three most important points to understand this article:
- The number of housing starts in May increased by 57.7 percent compared to the same month last year. However, the actual number decreased from April.
- The number of rented homes and built-for-sale homes changes greatly every month. On the other hand, the number of owned homes remained at the same level as April, working as the foundation of the market.
- Investment money, which was concentrated in Toyama City, spread to Takaoka and Imizu cities. Meanwhile, development of business properties stopped in surrounding areas, and these areas returned to an owned-home market.
Local Markets Depend on Single Projects
In May 2026, there were 350 new housing starts in Toyama Prefecture. This is a 57.7 percent increase compared to the same month last year. In April, the number was 413 units, an 88.6 percent increase. The growth rate is still high, but the absolute number of starts decreased by 63 units from the previous month.
This decrease happened because the movement of investment money slowed down. Rented homes decreased from 147 units in April to 90 units in May. Built-for-sale homes also dropped from 43 to 29 units. In April, there was a large project of 27 rental apartments in Himi City. However, in May, there were no large projects like that. In local real estate markets, the construction of business properties changes greatly depending on whether there are single projects each month. The high year-on-year increase includes a reaction to the low numbers of the previous year. It does not mean the whole market is growing continuously.
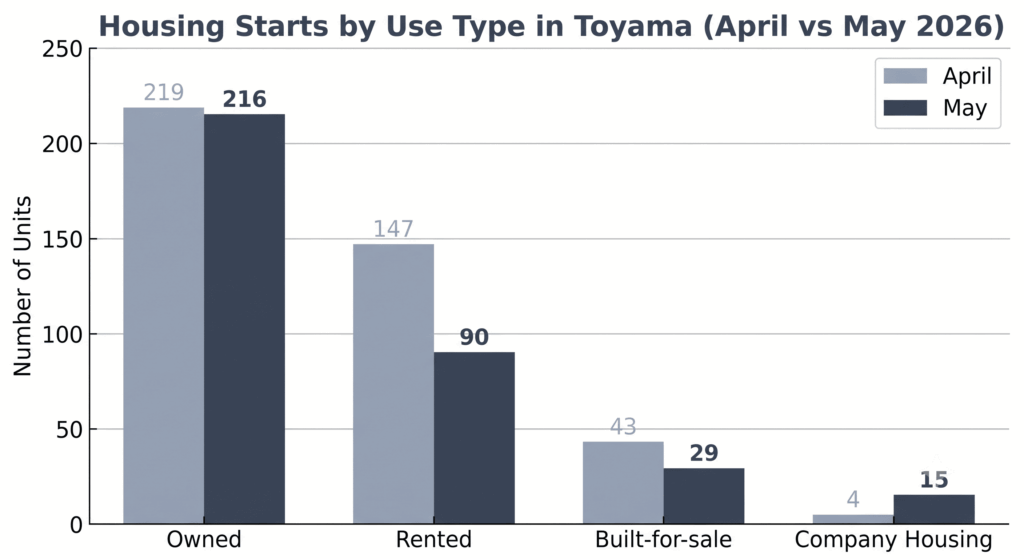
This graph compares the number of housing starts by use type in Toyama Prefecture for April and May 2026. It visualizes the decrease in rented and built-for-sale homes.
The Stability of Owned Homes Supporting the Market
Unlike business properties that go up and down a lot, the market for owned homes, based on personal demand, is very stable.
The number of owned homes started in Toyama Prefecture was 219 units in April. In May, it was 216 units. While the total number of housing starts shrank, only owned homes maintained a flat number. In the Toyama real estate market, the supply of business properties only creates temporary waves. The foundation of the market is supported by individual demand for owned homes.
Dispersion of Investment Areas and Retreat from Surrounding Areas
Looking at the number of starts by region, the destination of investment money is moving locally.
Toyama City’s share of total starts dropped from about 50 percent in April to about 45 percent in May. This is because the number of starts in Toyama City decreased from 208 to 156 units. Among them, rented homes shrank from 91 to 56 units.
Instead of Toyama City, investment money went to western areas like Takaoka and Imizu cities. In Takaoka City, out of 64 total units, 26 rented homes and 11 built-for-sale homes were started. In Imizu City, out of 37 units, 14 were company housing apartments. The extreme concentration in Toyama City softened a bit, and the development of business real estate was successful in the core western areas.
On the other hand, the development of business properties stopped in the surrounding areas. Himi City, which had 35 units in April, dropped to 5 units in May. All 5 units are owned homes. Looking at the whole eastern area, including Uozu and Kurobe cities, 45 out of 56 units are owned homes. When a specific development project finishes, that area quickly returns to a market centered on owned homes. The border is becoming clear between areas where only owned homes are built and areas where business development is successful.
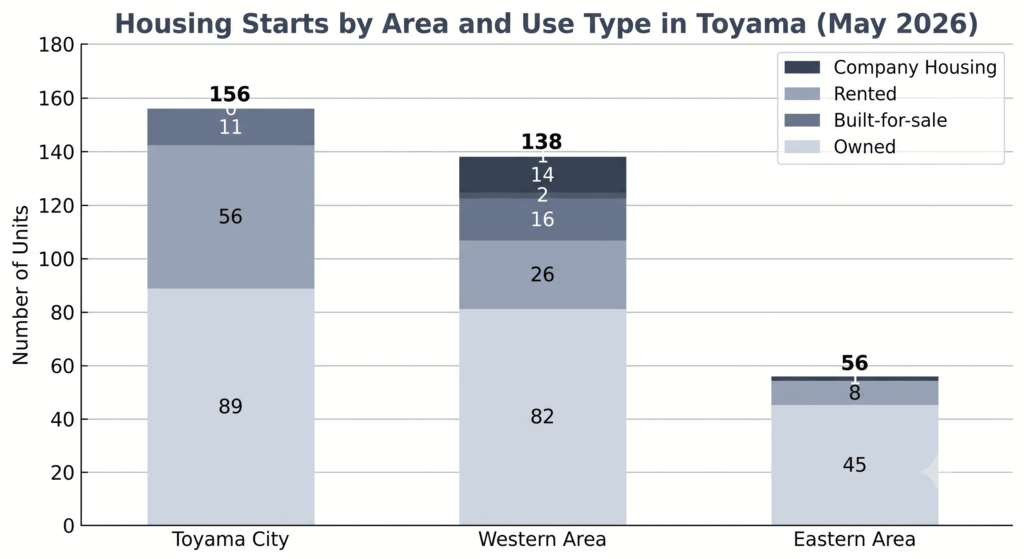
Note: Graph 2 divides Toyama Prefecture into three areas (Toyama City, Western Area, and Eastern Area) for May 2026. It compares the number of housing starts by use type using stacked bar charts.